THERMOGRADIENT TABLE/TIME-LAPSE VIDEO
TOOL DESCRIPTION
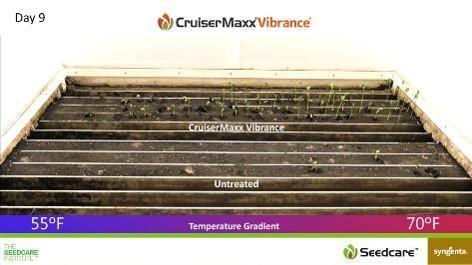
To visualize the difference between different types of treatments (or untreated seeds), to showcase the impact of different soil temperature conditions on product perfomance. In addition, environmental factors such as soil moisture, pests and diseases can be studied and results evaluated and showcased.
Use possibilities: all crops, different substrates (natural field soils, artificial growth substrates), products (seed treatment products, micronutrient products, crop enhancement products), diverse pests (e.g. Wireworms, nematodes) and seed borne/soil borne diseases (e.g. Rhizoctonia, Pythium, Fusarium, Tilletia, etc).
ALREADY ESTABLISHED FOR
HOW IT IS USED
- Demo material for on-site training and tours
- Technical data generation for product positioning at local market level, “reasons to believe” (reports, presentation, etc...)
- Digital data: photo, time-lapse videos

QUICK FACTS
- FOCUS: SEEDLING, DIGITAL, PATHOGEN
- COST: $18,000 TO $25,000
- TIME TO RUN AN EXPERIMENT: 2 TO 8 WEEKS DEPENDING ON THE CROP AND ENVIRONMENTAL CONDITIONS (IF PROTOCOL ALREADY PRE-DEVELOPED)
- MOBILITY: STATIONARY
- LEVEL OF COMPLEXITY: COMPLICATED
- ENVIRONMENTAL CONDITIONS: VARIABLE IN REALISTIC RANGE
- NOTE:THE TABLES ARE PRODUCED IN USA (COLLABORATION WITH 3RD PARTY SCIENTIST)

CONTACT
yarina.sheremet@syngenta.com,
Global Lead Seed Safety & Prod Marketing